
AgroAlgo Synthetics
Evidence record.
Six retained H1 strategies for the separately licensed $400 AgroAlgo Synthetics product, evaluated with the exact AgroAlgo 9.30 engine against current Deriv MT5 history.
Historical MT5 backtest evidence from the canonical AgroAlgo 9.30 EngineProbe. Tests used Model 1, 1-minute OHLC, random delay, a $10,000 initial deposit and 0.35% risk per trade. Runs warmed from 2019. Measurement starts vary by available post-cutoff history, and the latest exits occurred on 8 August 2026. This is research evidence, not live-forward performance, sealed evidence or release approval. The settings were already selected, so the recent slice is not an untouched policy holdout. No Standard-mode evidence is claimed.
- 01
- Exact AgroAlgo 9.30 canonical engine through Agro930EngineProbe.
- 02
- MetaTrader 5 Model 1, 1-minute OHLC, with random execution delay.
- 03
- $10,000 initial deposit and 0.35% risk per trade.
- 04
- All strategies run on H1 and warm from 1 January 2019.
- 05
- Measurement starts in 2021, 2024 or 2025 according to each model's post-cutoff history. Latest exits are 8 August 2026.
- 06
- The incumbent settings were retained after challenger comparison. The displayed recent slice is settings-seen.
- 07
- No live-forward, sealed-evidence, Standard-mode or release-approval claim is made.
Range Break 100
Deriv synthetic index
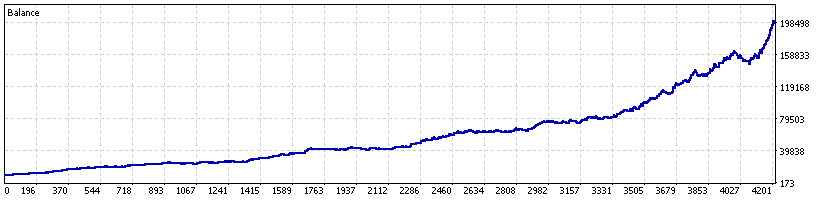
- Profit Factor
- Net Return
- CAGR
- Max DD
- Trades
- 3,728
- Measured
- 2021 to 8 Aug 2026
- Risk per trade
- 0.35%
- Recent historical slice
- PF 1.419 · +277.94R · 1,042 trades
- Completed positive years
- 5 of 5
Thresholds 0.80 / 0.32 · SL 1.0×ATR · R:R 2.5 · maximum hold 48 bars · minimum spacing 4 bars
Crash 1000
Deriv synthetic index
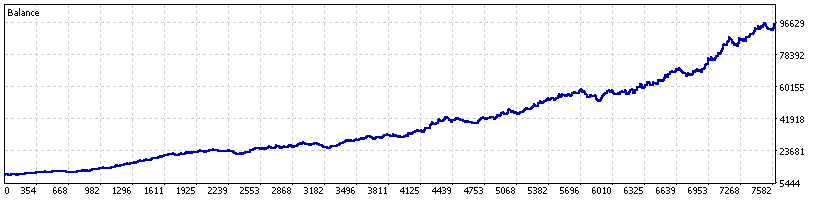
- Profit Factor
- Net Return
- CAGR
- Max DD
- Trades
- 5,883
- Measured
- 2021 to 8 Aug 2026
- Risk per trade
- 0.35%
- Recent historical slice
- PF 1.165 · +157.96R · 1,696 trades
- Completed positive years
- 5 of 5
Thresholds 0.60 / 0.16 · SL 1.0×ATR · R:R 1.5 · no fixed hold cap · minimum spacing 4 bars
Boom 1000
Deriv synthetic index
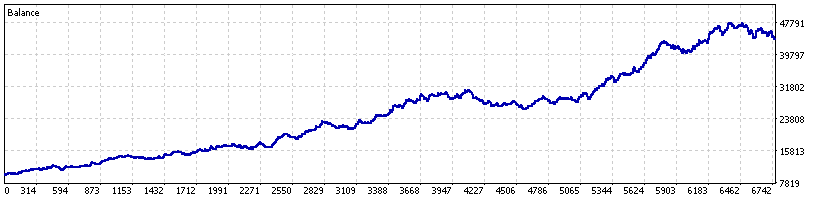
- Profit Factor
- Net Return
- CAGR
- Max DD
- Trades
- 5,178
- Measured
- 2021 to 8 Aug 2026
- Risk per trade
- 0.35%
- Recent historical slice
- PF 1.090 · +77.25R · 1,477 trades
- Partial 2026
- -13.19R
- Completed positive years
- 5 of 5
Thresholds 0.84 / 0.28 · SL 1.0×ATR · R:R 1.5 · maximum hold 24 bars · minimum spacing 4 bars
DEX 1500 UP
Deriv synthetic index
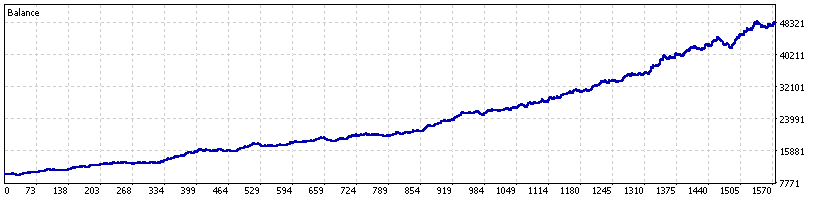
- Profit Factor
- Net Return
- CAGR
- Max DD
- Trades
- 881
- Measured
- 2025 to 8 Aug 2026
- Risk per trade
- 0.35%
- Recent historical slice
- PF 1.496 · +273.45R · 881 trades
- Completed positive years
- 1 of 1
Thresholds 0.84 / 0.20 · SL 1.0×ATR · R:R 2.5 · no fixed hold cap · minimum spacing 4 bars
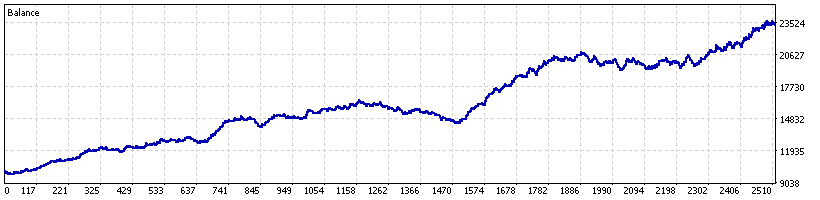
DEX 600 UP
Deriv synthetic index
- Profit Factor
- Net Return
- CAGR
- Max DD
- Trades
- 1,421
- Measured
- 2025 to 8 Aug 2026
- Risk per trade
- 0.35%
- Recent historical slice
- PF 1.141 · +113.08R · 1,421 trades
- Completed positive years
- 1 of 1
Thresholds 0.84 / 0.32 · SL 1.0×ATR · R:R 1.5 · maximum hold 24 bars · minimum spacing 4 bars
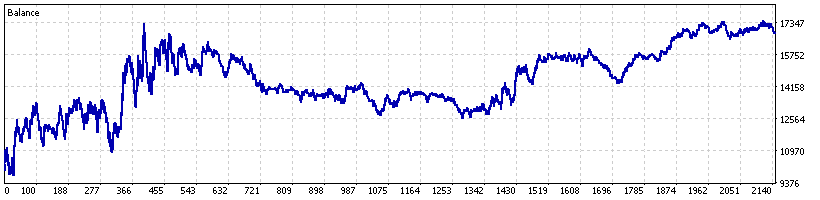
Crash 300
Deriv synthetic index
- Profit Factor
- Net Return
- CAGR
- Max DD
- Trades
- 1,110
- Measured
- 2024 to 8 Aug 2026
- Risk per trade
- 0.35%
- Recent historical slice
- PF 1.143 · +48.20R · 673 trades
- Completed positive years
- 2 of 2
- Update status
- Pending separate review
Thresholds 0.68 / 0.36 · SL 2.5×ATR · R:R 2.5 · maximum hold 24 bars · minimum spacing 4 bars
All six incumbents remained net positive across their complete post-cutoff replay and the 2025-current historical slice; no challenger was promoted. Boom 1000 remains positive over the complete record but recorded -13.19R in the partial 2026 calendar year, a limitation that should remain visible when interpreting its curve. Boom 500 remains excluded. Historical results can differ materially from live execution and do not guarantee future results.